 ar
ar bg
bg hr
hr cs
cs da
da nl
nl fi
fi fr
fr de
de el
el hi
hi it
it ko
ko no
no pl
pl pt
pt ro
ro ru
ru es
es sv
sv tl
tl iw
iw id
id lv
lv lt
lt sr
sr sk
sk sl
sl uk
uk vi
vi et
et hu
hu th
th tr
tr fa
fa ms
ms hy
hy ka
ka ur
ur bn
bn mn
mn ta
ta kk
kk uz
uz ku
ku
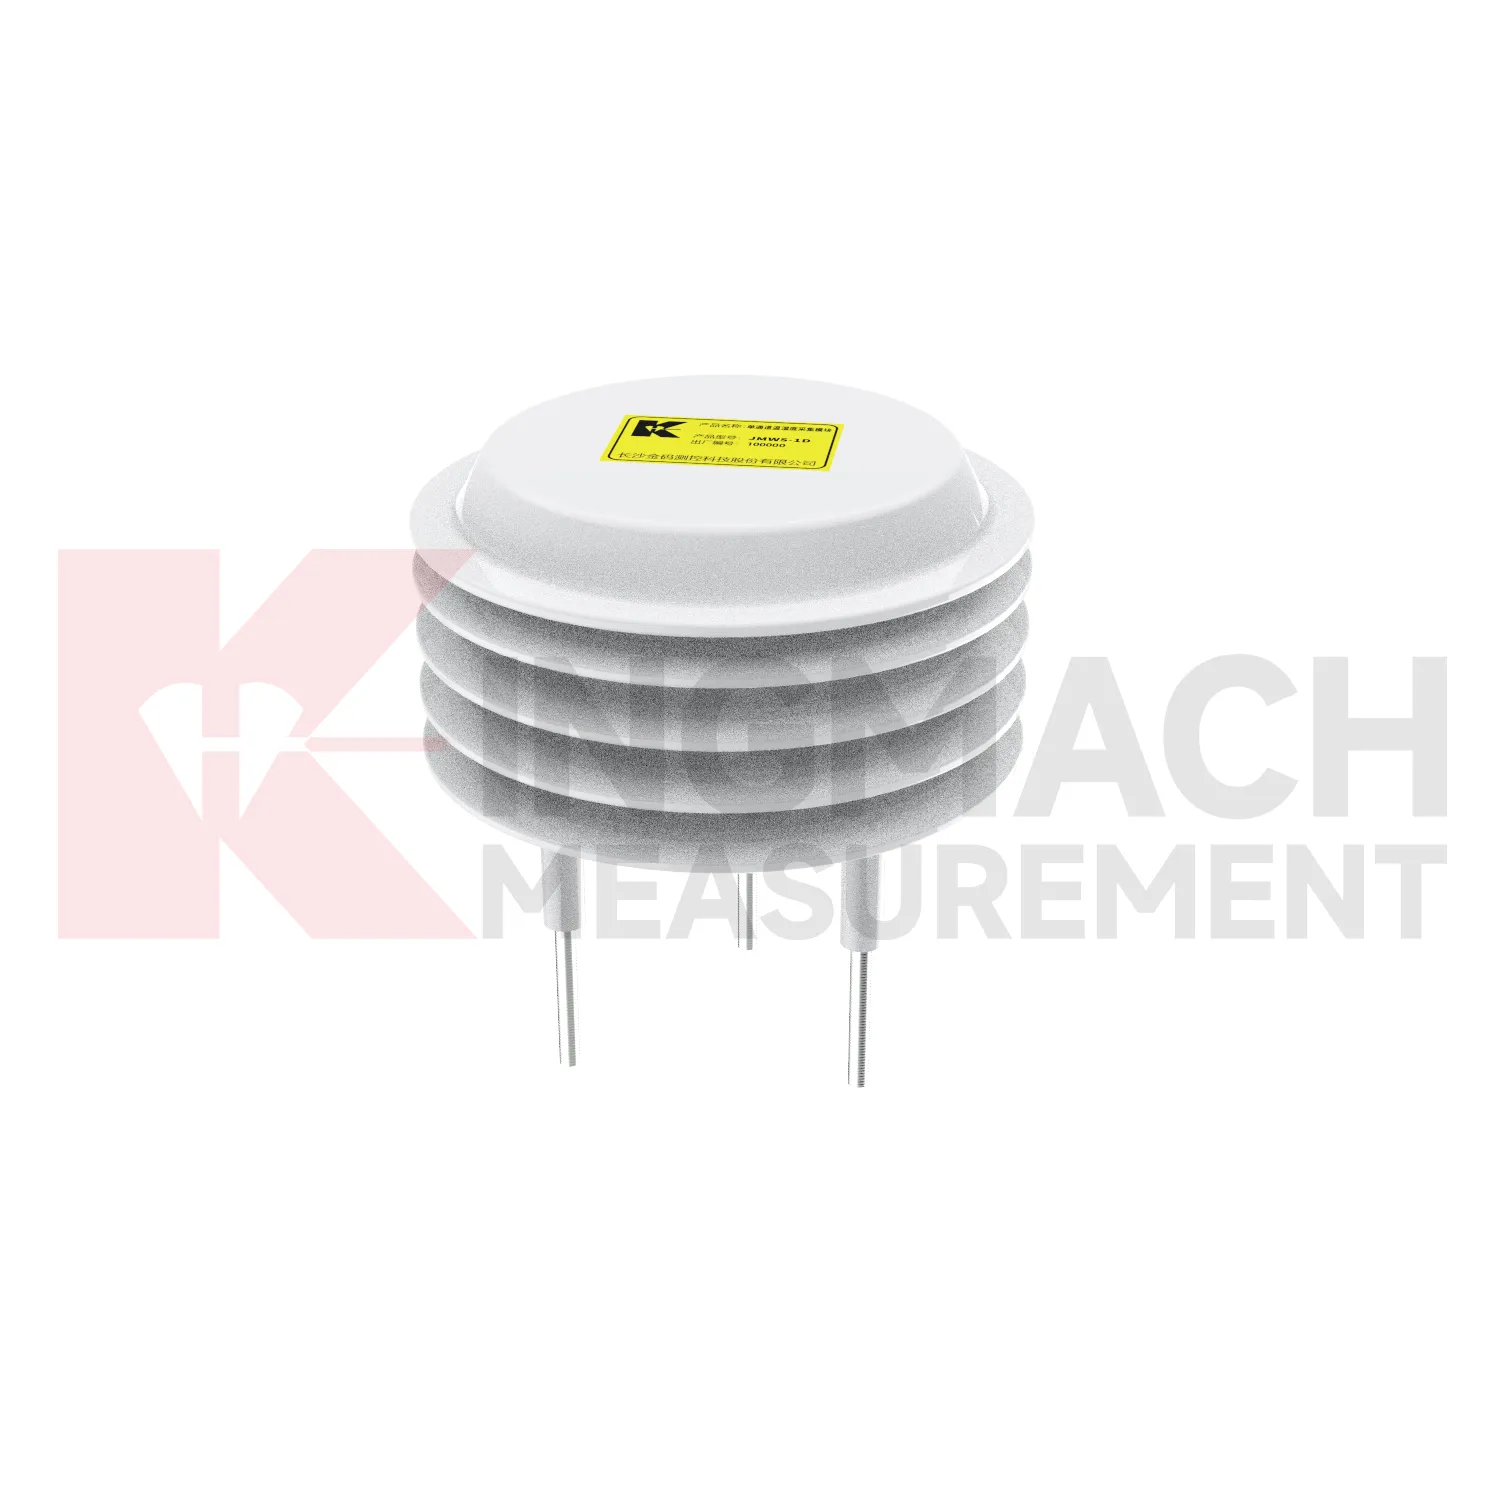
resistance temperature sensor
Temperature monitoring in Kingmach resistance temperature sensor gives engineers a way to separate environmental effects from structural change. Many materials expand and contract with heat. Sensors, cables, cabinets, and enclosures also behave differently under temperature stress. In bridges, temperature can affect strain and displacement records. In tunnels, it can interact with humidity and ventilation. In industrial areas, it may follow equipment operation. In energy, transportation, railway, and construction settings, a stable temperature record helps reviewers avoid treating a thermal pattern as a structural defect. The monitoring point should be placed according to the question being asked: material temperature, air condition, cabinet environment, or general site exposure. Each placement tells a different story, and the report should make that difference clear.
A good review habit is to compare the condition channel with the nearest asset behavior instead of reading it as a standalone weather value. That keeps the record tied to slope movement, bridge response, tunnel equipment, dam seepage, drainage behavior, or cabinet reliability.
The installation file should explain why the location represents the monitored area. If the point is sheltered, shaded, exposed, buried, elevated, or placed inside an enclosure, that fact changes how later readings should be understood by maintenance staff.
During abnormal events, the first question is not only whether the value crossed a limit. The reviewer should ask what changed around the site, whether the related structure reacted, and whether a field inspection confirmed the same pattern.
Application of resistance temperature sensor
Bridge projects use Kingmach resistance temperature sensor to understand the conditions that surround structural response. Wind can drive vibration and deck movement. Temperature can affect expansion, strain, and displacement. Humidity and rain can influence cabinets, connectors, corrosion, and inspection timing. A bridge record becomes more useful when environmental channels are aligned with traffic, strain, acceleration, tilt, settlement, and visual inspection data. Placement matters: wind data should represent the bridge exposure, temperature should match the structural or air condition being reviewed, and cabinet humidity should be measured near the equipment it may affect. During a vibration alarm, engineers can check whether the event matched strong wind, temperature swing, heavy rain, or unusual traffic. That context helps separate normal operating response from behavior that deserves a field review.
The environmental point should be part of a named monitoring question. It may explain wetting, drying, wind exposure, thermal movement, cabinet stress, or pressure variation, but that purpose needs to be visible in drawings and reports.
If the reading seems unusual, the team should check the physical condition of the station before drawing conclusions about the asset. Blockage, poor exposure, loose wiring, water entry, and changed surroundings can all create misleading patterns.
A practical report links the condition value with time, place, and action. It should help a reviewer decide whether to keep observing, inspect the field point, compare nearby instruments, or record the event as normal site behavior.
The future of resistance temperature sensor
Compatibility will remain a future requirement for Kingmach resistance temperature sensor. Environmental stations often combine different signal paths, power needs, units, enclosures, cables, and data logger settings. If these details are not planned, installation becomes slow and later replacement becomes confusing. Future specifications should define data output, unit conversion, channel capacity, sampling plan, power source, protection needs, maintenance access, and platform display before installation begins. Clear compatibility keeps environmental data usable through commissioning, operation, repair, and handover. It also prevents a monitoring station from becoming dependent on undocumented field improvisation.
Future compatibility work should also cover spare parts and replacement paths. If a station must be repaired after years of service, the owner should know which signal type, unit conversion, connector style, enclosure space, and platform channel are required before field crews arrive.
This planning reduces downtime during storms, construction stages, and maintenance windows. It also helps teams replace one component without changing the meaning of the environmental record or breaking the link to structural channels.
Care & Maintenance of resistance temperature sensor
Rainfall maintenance for Kingmach resistance temperature sensor should focus on keeping the catchment path clean and level. Leaves, dust, insects, scale, bird droppings, splash, and tilted mounting can distort rainfall records. The rain point should be inspected after storms, long dry periods, nearby earthwork, and seasonal debris build-up. Cleaning should be logged with date, condition, leveling status, and the first normal reading after work. Rainfall data is often used to explain slope movement, seepage, tunnel leakage, construction delay, or drainage performance. If the rain record is wrong, the engineering interpretation may also be wrong. Simple field care protects a much larger monitoring decision.
Maintenance teams should record cleaning, access difficulty, enclosure condition, cable repair, vegetation growth, nearby equipment changes, and the first normal reading after work. Those notes protect the meaning of the curve when old data is reviewed months later.
The environmental point should be part of a named monitoring question. It may explain wetting, drying, wind exposure, thermal movement, cabinet stress, or pressure variation, but that purpose needs to be visible in drawings and reports.
Kingmach resistance temperature sensor
Kingmach resistance temperature sensor is most useful when environmental data is treated as context for other measurements. Temperature can explain thermal expansion or sensor drift. Rainfall can explain slope movement, seepage, or delayed settlement. Humidity can affect cabinets, connectors, corrosion, and tunnel equipment rooms. Wind can explain bridge vibration, tower movement, or difficult access conditions. Soil wetness can help interpret embankment behavior and shallow ground response. These conditions do not replace structural instruments; they help those instruments make sense. A good monitoring file shows the environmental trigger, the structural response, the inspection note, and the time relation between them. That combination gives owners a clearer basis for maintenance and field decisions.
The installation file should explain why the location represents the monitored area. If the point is sheltered, shaded, exposed, buried, elevated, or placed inside an enclosure, that fact changes how later readings should be understood by maintenance staff.
During abnormal events, the first question is not only whether the value crossed a limit. The reviewer should ask what changed around the site, whether the related structure reacted, and whether a field inspection confirmed the same pattern.
FAQ
Q: Where should a rain point be placed?
A: It should be level, open to the sky, and away from obstructions, splash sources, roof edges, and debris-prone areas.
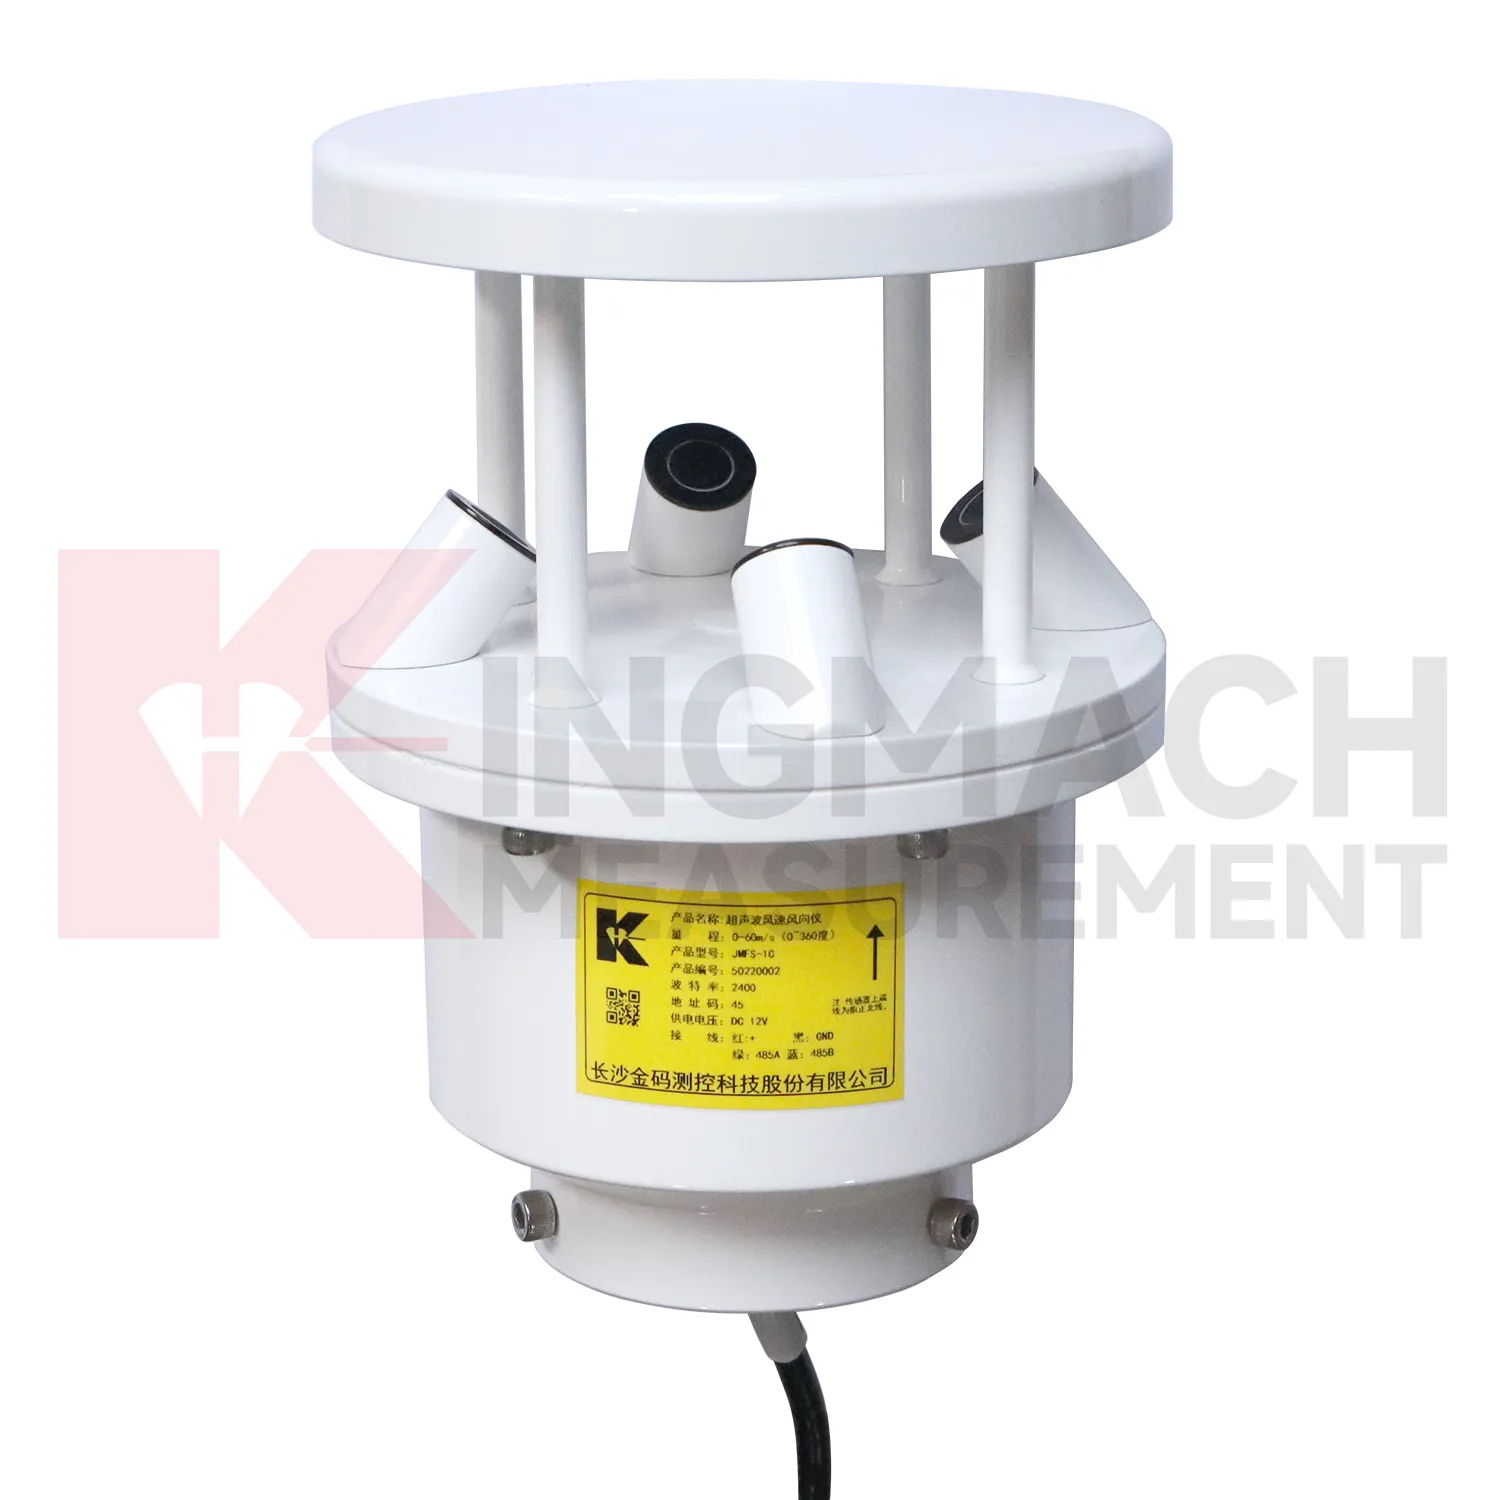
Q: Where should wind be measured?
A: Wind should be measured where airflow represents the asset or work area being reviewed, not behind a wall or sheltered obstruction.
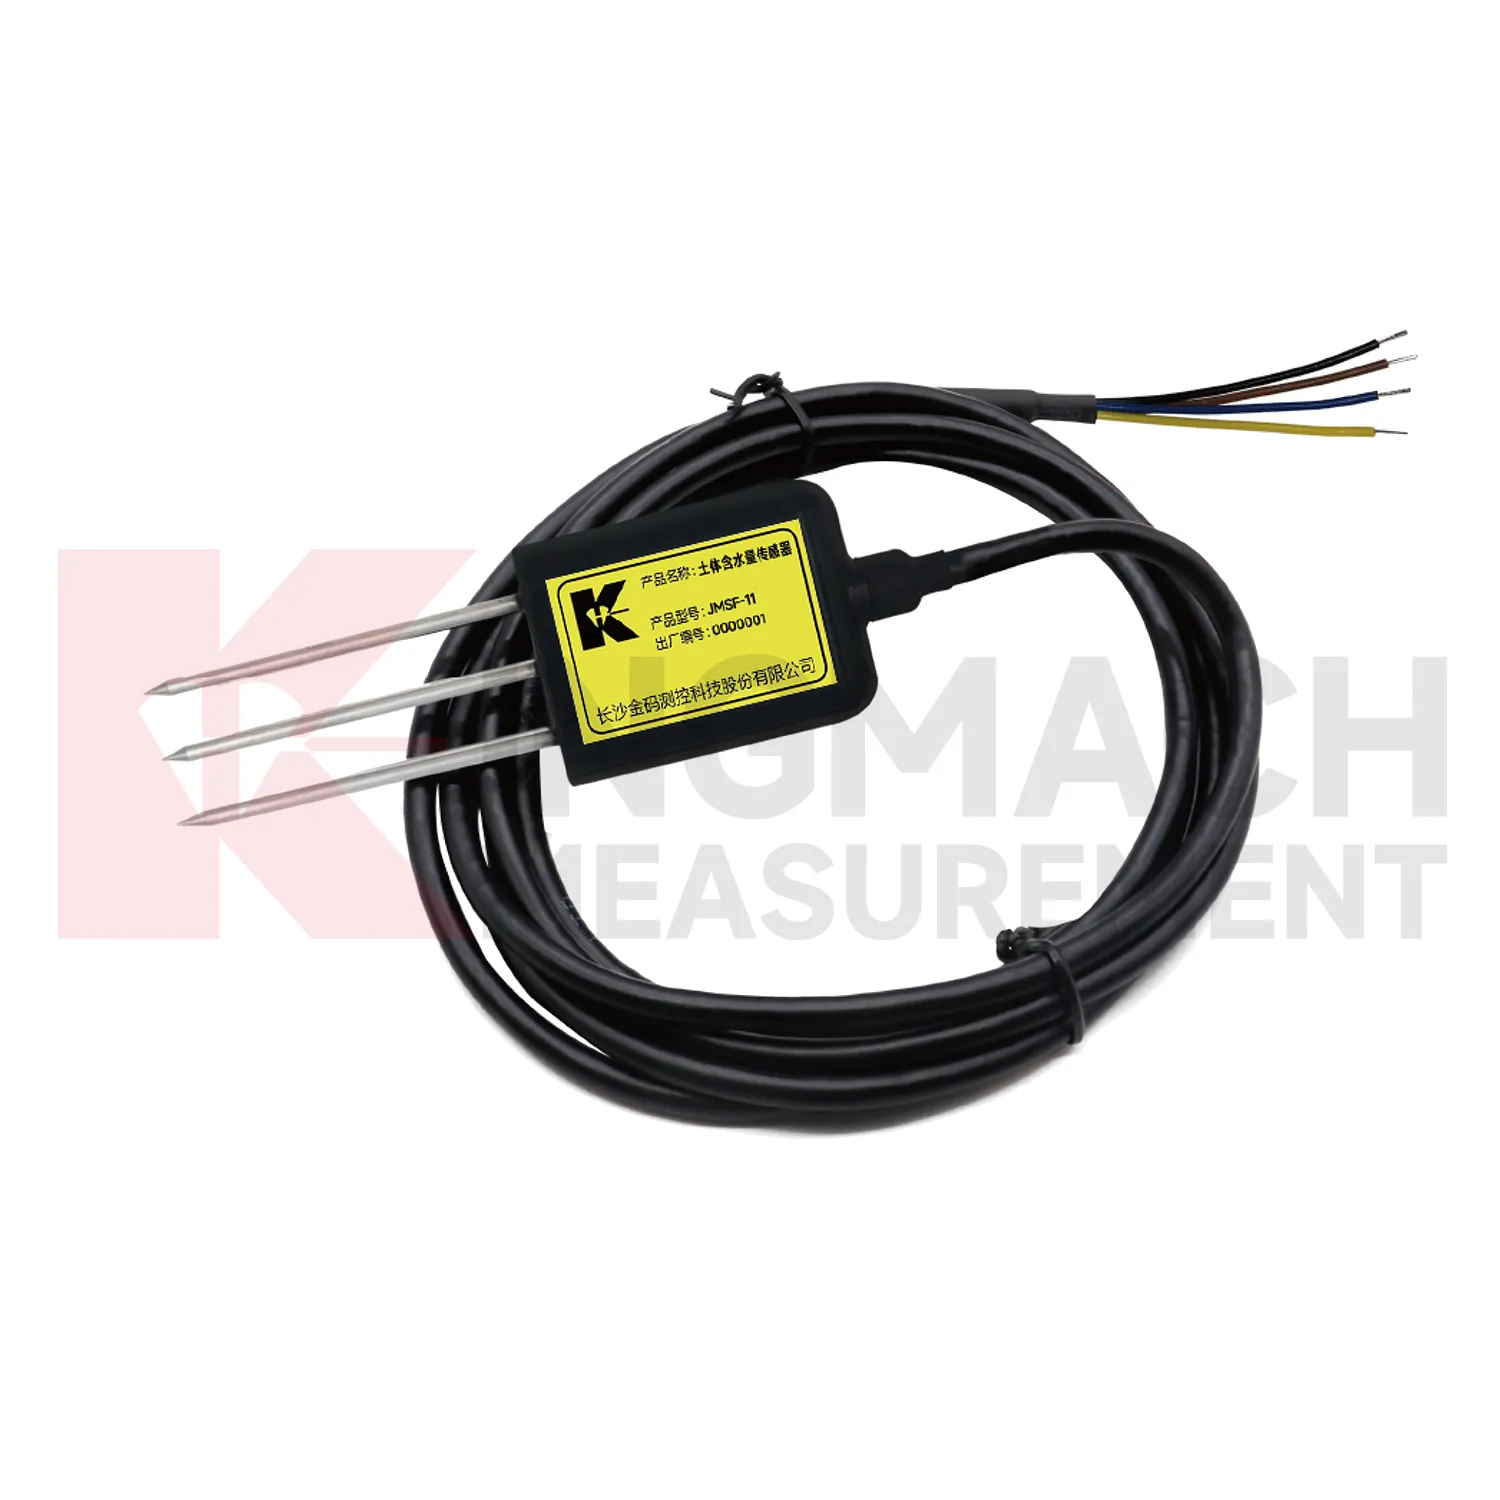
Q: How should soil points be installed?
A: They should have firm contact with the surrounding soil, a recorded depth, protected cable route, and a stable first value.
Q: What should commissioning records include?
A: Include point location, measured condition, unit, mounting photo, cable route, power source, data channel, and linked structural record.
Q: Why are photos useful?
A: Photos help future reviewers understand exposure, mounting, cable routing, and whether later site changes affected readings.
Maintenance teams should record cleaning, access difficulty, enclosure condition, cable repair, vegetation growth, nearby equipment changes, and the first normal reading after work. Those notes protect the meaning of the curve when old data is reviewed months later.
Reviews
Daniel Brown
Excellent environmental monitoring sensors. The data is consistent, and the system integrates smoothly with our existing setup.
Andrew Lee
The visualization software is intuitive and powerful. It helps us analyze monitoring data efficiently.
Latest Inquiries
To protect the privacy of our buyers, only public service email domains like Gmail, Yahoo, and MSN will be displayed. Additionally, only a limited portion of the inquiry content will be shown.
Amelia***@gmail.comSingapore
Hello, I am looking for visualization software for monitoring system data analysis. Please let me kn...
Evelyn***@gmail.comSouth Africa
Hi, we are a contractor working on tunnel construction and need settlement sensors and displacement ...
Related product categories
- wind direction and speed sensor
- wind speed and direction sensors
- tipping bucket rain gauge
- tipping bucket rain gauge resolution 0.2 mm standard
- tipping bucket rain gauges
- tipping bucket rain gauge resolution 0.1 mm 0.2 mm standard
- tipping bucket rain gauge resolution 0.1 mm standard
- rain gauge tipping bucket
- tipping bucket rain gauge sensor
- tipping bucket type rain gauge
- tipping rain bucket gauge
- tipping bucket rain gauge 0.2 mm per tip standard