 ar
ar bg
bg hr
hr cs
cs da
da nl
nl fi
fi fr
fr de
de el
el hi
hi it
it ko
ko no
no pl
pl pt
pt ro
ro ru
ru es
es sv
sv tl
tl iw
iw id
id lv
lv lt
lt sr
sr sk
sk sl
sl uk
uk vi
vi et
et hu
hu th
th tr
tr fa
fa ms
ms hy
hy ka
ka ur
ur bn
bn mn
mn ta
ta kk
kk uz
uz ku
ku
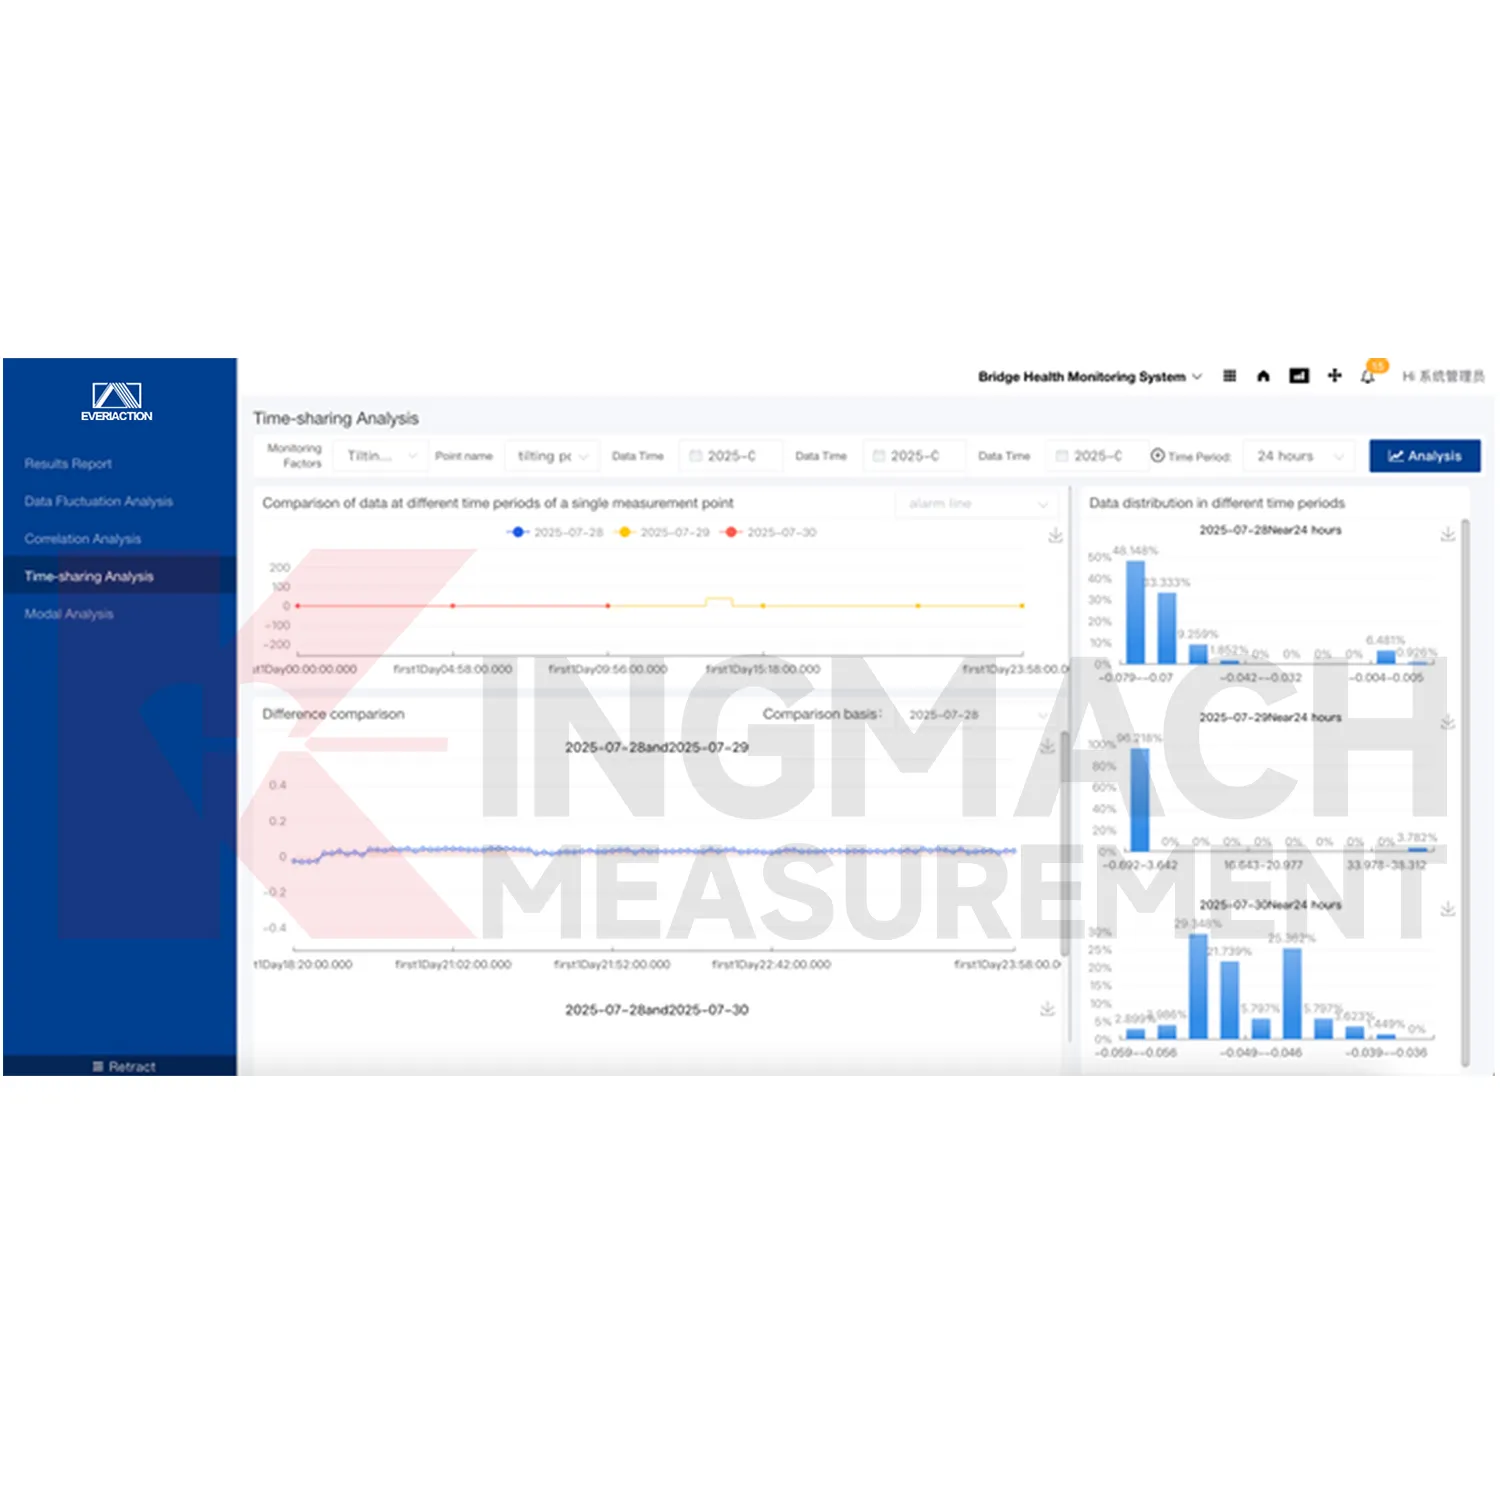
Visualization Software
The platform is compatible with hardware devices from different manufacturers, different types, and different models. Devices can transmit data to the Cloud Platform by wired or wireless means. This matters for engineering owners because monitoring systems are often built in stages. A project may begin with a few sensors, then add acquisition modules, wireless transmission, environmental channels, displacement points, strain points, or water-level instruments later. Kingmach Visualization Software gives those devices a shared environment for storage, review, visualization, alarm handling, and reporting.
Application of Visualization Software
Environmental monitoring networks use Kingmach Visualization Software to connect rainfall, wind, temperature, humidity, water level, soil moisture, and related structural readings. Environmental data often explains why a structural channel changed. For example, rainfall may affect slope movement, temperature may affect strain readings, and water level may affect dam or foundation behavior. A shared platform helps reviewers see these relationships more clearly and prepare reports that include both the measured response and the surrounding condition.
The future of Visualization Software
Future use of Kingmach Visualization Software will grow as civil engineering monitoring moves from isolated instrument readings to connected asset management. More structures will rely on sensors, acquisition modules, wireless devices, and cloud platforms to maintain a continuous safety record. The software layer will become the place where owners review not just one reading, but the relationship between trends, alarms, inspections, weather, construction, and maintenance work. A platform that integrates multiple data sources will be central to that shift.
Care & Maintenance of Visualization Software
Alarm rules in Kingmach Visualization Software should be reviewed by engineering staff, not copied blindly across every point. Different structures, sensors, and risk levels need different alarm logic. A settlement point, strain point, water-level point, and tilt point may require different thresholds, rate checks, and response procedures. After the first operating period, review alarm history and adjust rules where ordinary behavior is creating unnecessary alerts or where a critical pattern needs faster attention.
Kingmach Visualization Software
For project managers, Kingmach Visualization Software gives each monitored asset a defined operating file instead of a loose collection of screens. The team can maintain project basics, live status, inspection notes, maintenance activity, alarm levels, and documents under the same project name. This is useful when an owner needs to explain who checked the data, what changed on site, which alarm was acknowledged, and which report followed. The platform turns daily monitoring into a traceable management routine, so later audits can follow the project history without rebuilding it from scattered folders.
FAQ
Q: What certification is listed?
A: The product information lists GB50982-2014 certification.
Q: What is the minimum order quantity?
A: The local product page lists one piece as the minimum order quantity.
Q: What is the delivery time?
A: Delivery time is listed as instant for the software platform.
Q: How is pricing handled?
A: Pricing is listed as negotiable, so project scope, configuration, and integration needs should be confirmed with Kingmach.
Q: What payment term is shown?
A: The local product page lists T/T in advance.
Reviews
Matthew Garcia
Instrumentation cables are durable and perform well even in harsh environments. Will definitely order again.
James Thompson
The tiltmeters and accelerometers are very sensitive and provide precise data. Perfect for our structural health monitoring system.
Latest Inquiries
To protect the privacy of our buyers, only public service email domains like Gmail, Yahoo, and MSN will be displayed. Additionally, only a limited portion of the inquiry content will be shown.
Harper***@gmail.comIndia
Dear Sir, we are planning to procure a complete monitoring system including strain gauges, tiltmeter...
Evelyn***@gmail.comSouth Africa
Hi, we are a contractor working on tunnel construction and need settlement sensors and displacement ...
Related product categories
- Monitoring Software Suite
- Monitoring system software platform
- Environmental Monitoring
- Visualization Software
- GPS Displacement Monitoring System
- Integrated Monitoring Station
- Settlement Monitoring Rod
- Structural Health Monitoring (SHM) System
- Structural Monitoring Cloud Platform
- IoT Online Monitoring System
- Monitoring System Platform & Services
- Engineering Pulse Intelligent Monitoring Cloud Platform